“Urban form and function have been studied extensively in urban planning and geographic information science. However, gaining a greater understanding of how they merge to define the urban morphology remains a substantial scientific challenge. Towards this goal, this paper addresses the opportunities presented by the emergence of crowdsourced data to gain novel insights into form and function in urban spaces. We are focusing in particular on information harvested from social media and other open-source and volunteered datasets (e.g. trajectory and OpenStreetMap data). These data provide a first-hand account of form and function from the people who define urban space through their activities. This novel bottom-up approach to study these concepts complements traditional urban studies work to provide a new lens for studying urban activity. By synthesizing recent advancements in the analysis of open-source data we provide a new typology for characterizing the role of crowdsourcing in the study of urban morphology. We illustrate this new perspective by showing how social media, trajectory, and traffic data can be analyzed to capture the evolving nature of a city’s form and function. While these crowd contributions may be explicit or implicit in nature, they are giving rise to an emerging research agenda for monitoring, analyzing and modeling form and function for urban design and analysis.”
This paper builds and extends considerably our prior work, with respect to crowdsourcing, volunteered and ambient geographic information. In the scope of this paper we use the term ‘urban form’ to refer to the aggregate of the physical shape of the city, its buildings, streets, and all other elements that make up the urban space. In essence, the geometry of the city. In contrast, we use the term ‘urban function’ to refer to the activities that are taking place within this space. To this end we contrast how crowdsourced data can related to more traditional sources of such information both explicitly and implicitly as shown in the table below.
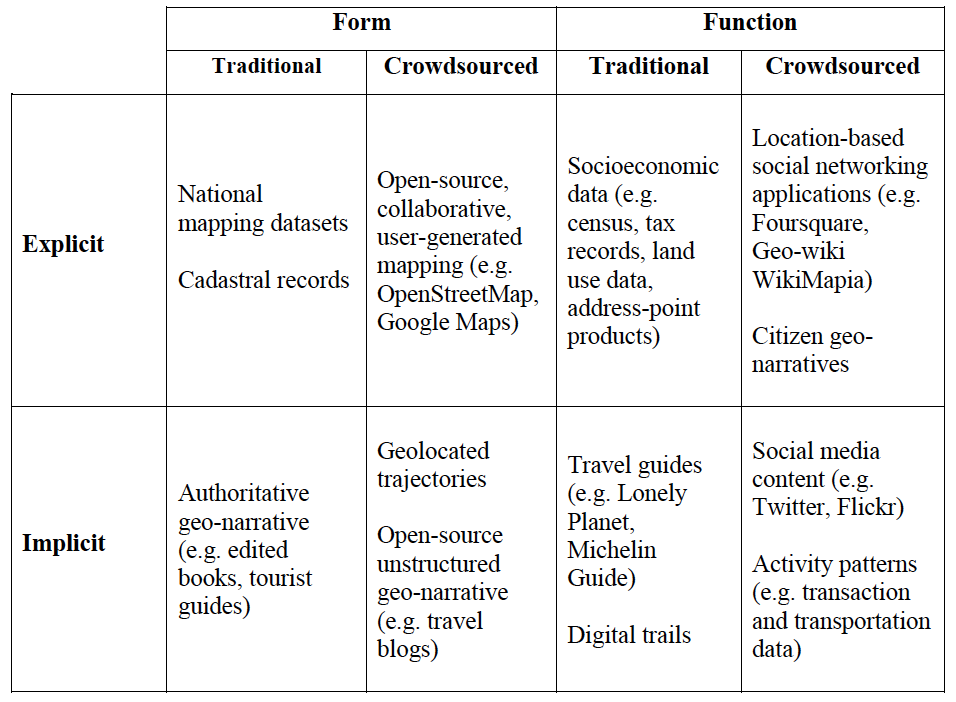 |
| A typology of implicit and explicit form and function content |
In addition, we also discuss in the paper how these new sources of data, which are often at finer resolutions than more authoritative data are allowing us to to customize the we we aggregate the data at various geographical levels as shown below. Such aggregations can range from building footprints and addresses to street blocks (e.g. for density analysis), or street networks (e.g. for accessibility analysis). For large-scale urban analysis we can revert to the use of zonal geographies or grid systems.
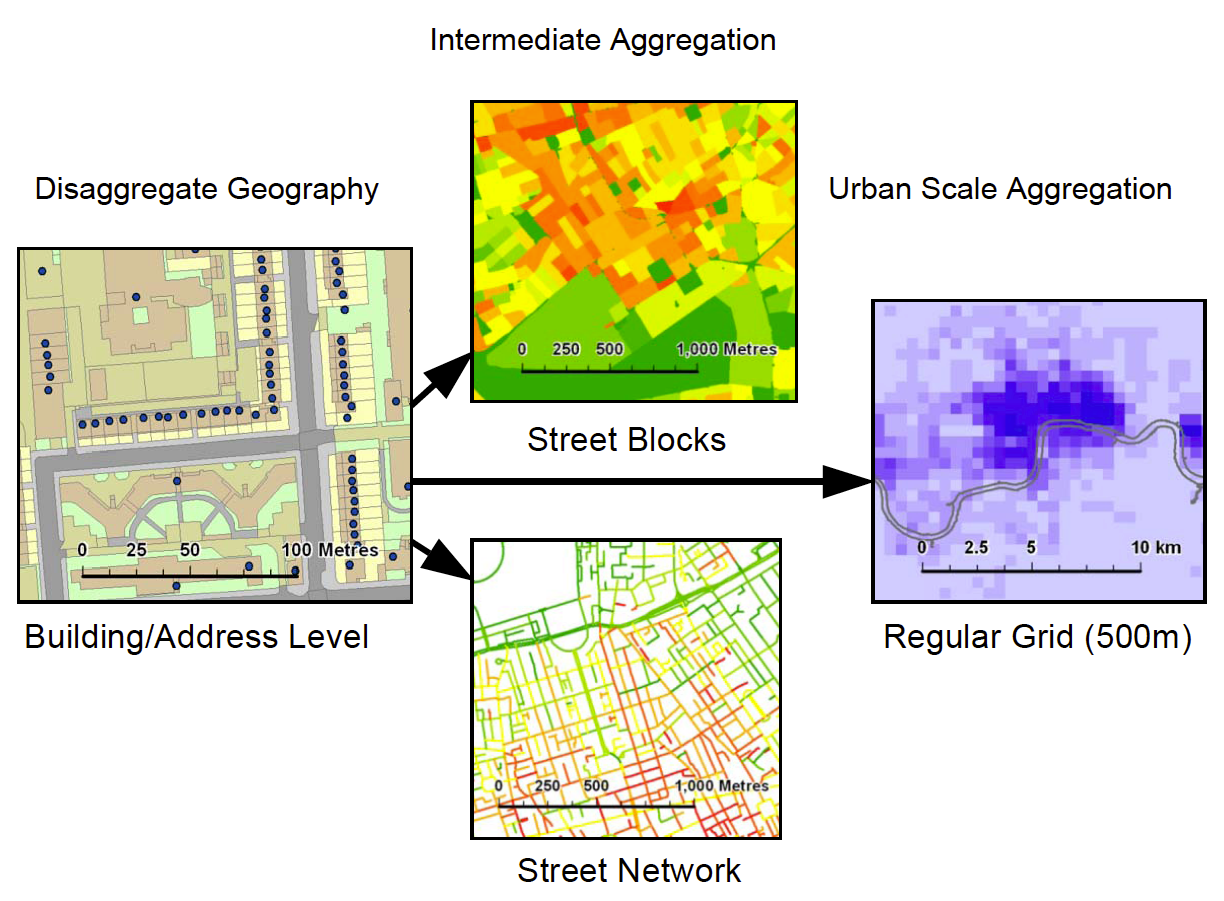 |
| Aggregation methods for varied scales of built environment analysis |
In the application section of the paper we highlight how we can extract implicit form and function from crowdsourced data. The image below for example, shows how we can take information from Twitter, and differentiate different neighborhoods over space and time.
 |
| Neighborhood map and topic modeling results showing the mixture of social functions in each area. |
Finally in the paper, we outline an emerging research agenda related to the “persistent urban morphology concept” as shown below. Specifically how crowdsourcing is changing how we collect, analyze and model urban morphology. Moreover, how this new paradigm provides a new lens for studying the conceptualization of how cities operate, at much finer temporal, spatial, and social scales than we had been able to study so far.
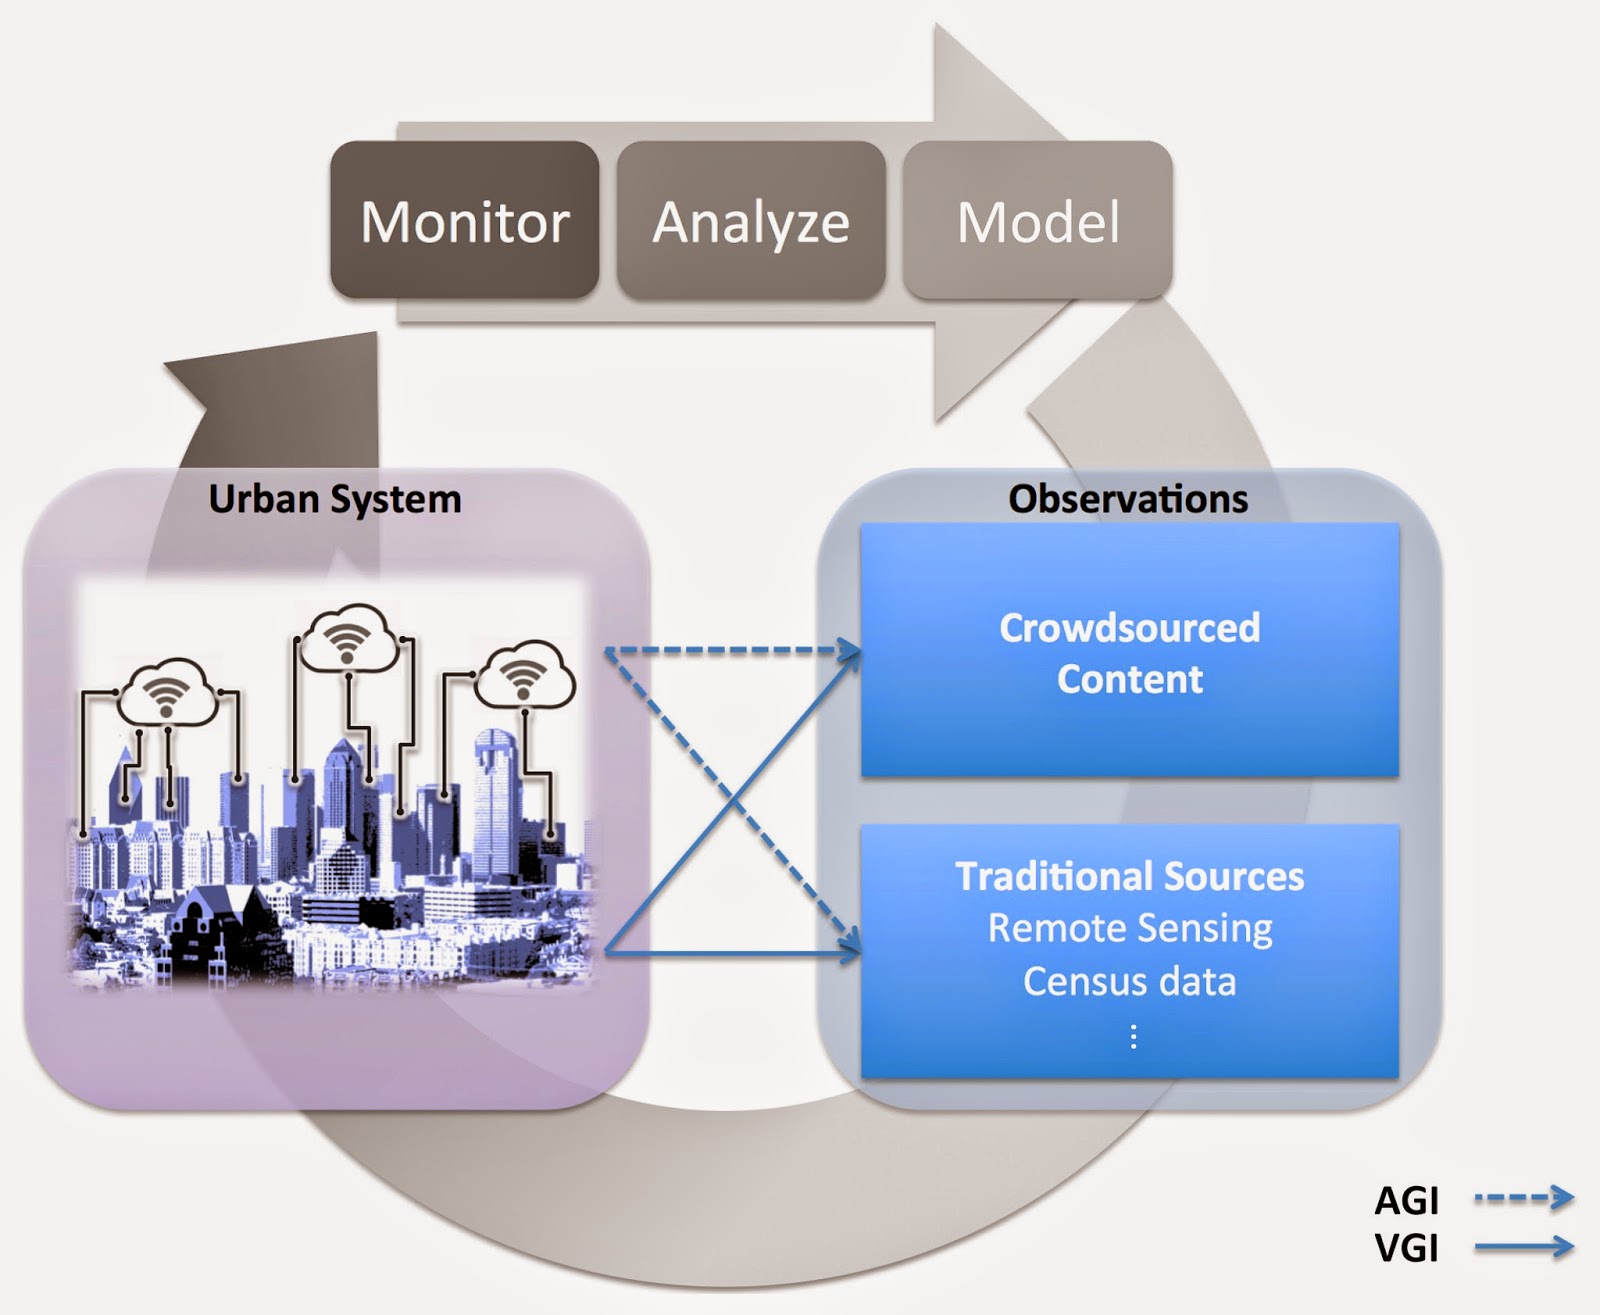 |
| The persistent urban morphology concept. |
We hope you enjoy the paper.
Full Reference:
Crooks, A.T., Pfoser, D., Jenkins, A., Croitoru, A., Stefanidis, A., Smith, D. A., Karagiorgou, S., Efentakis, A. and Lamprianidis, G. (2015), Crowdsourcing Urban Form and Function,
International Journal of Geographical Information Science.
DOI: 10.1080/13658816.2014.977905 (
pdf)
Continue reading »